Introduction to Python for Data Science
Gus Powers & Jay Cunningham
Introductions
Gus Powers
 |
Lead Data Scientist at 84.51°
Academic
Contact
|
Jay Cunningham
 |
Lead Data Scientist at 84.51°
Academic
Contact
|
Around The Room
We'll go around the room. Please share:
- Your name
- Your job or field
- How you use Python now or would like to in the future
Course
Defining Data Science
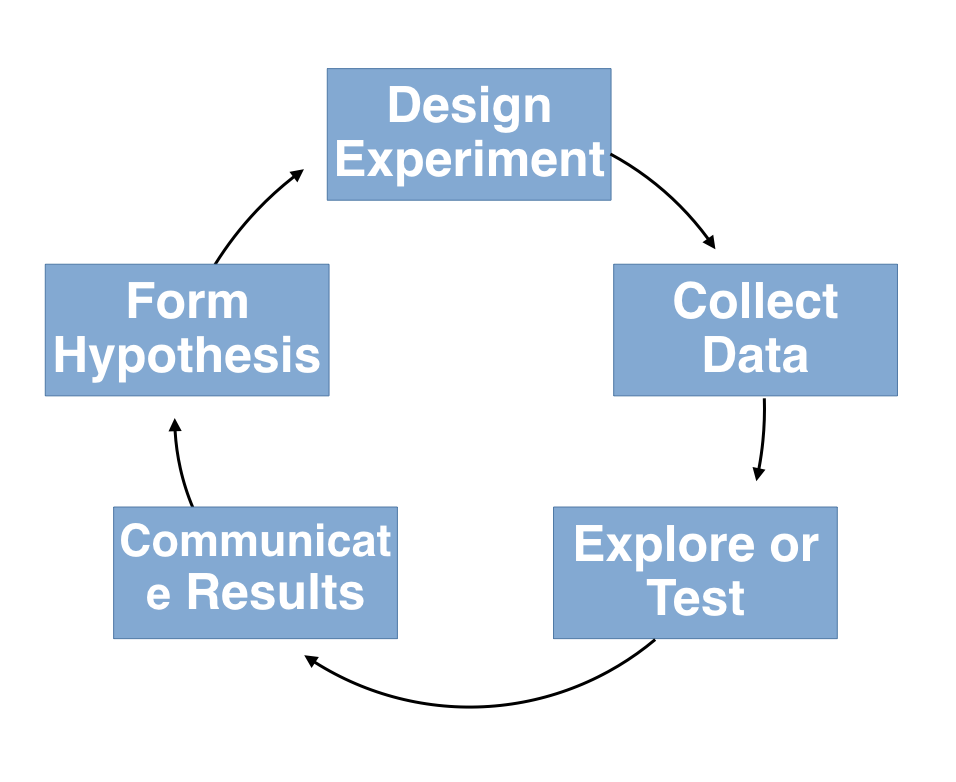
Data Science and Technology
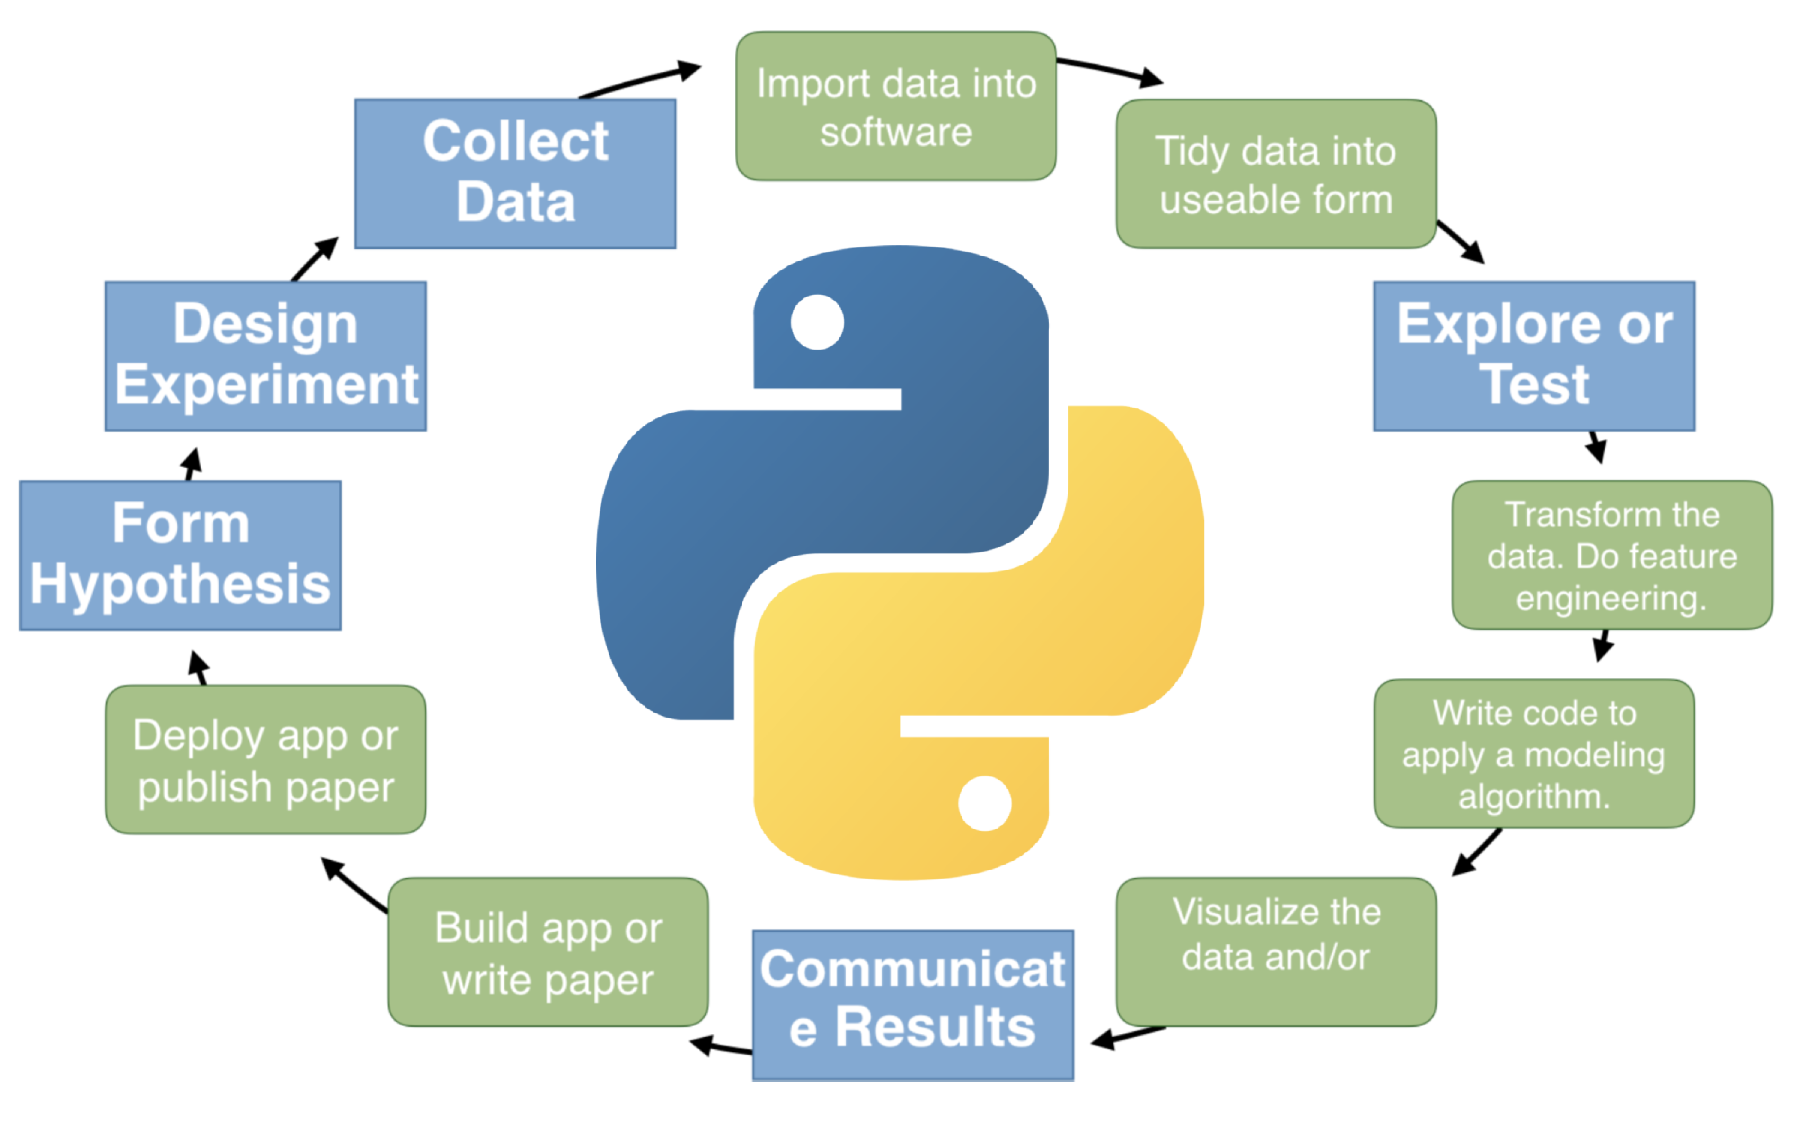
Applied Data Science

Course Objectives
The following are the primary learning objectives of this course:
- Develop comprehensive skills in the importing/exporting, wrangling, aggregating and joining of data using Python.
- Establish a mental model of the Python programming language to enable future self-learning.
- Build awareness and basic skills in the core data science area of data visualization.
Course Agenda
| Day | Topic | Time |
|---|---|---|
| Day 1 | Introductions | 12:30 - 12:45 |
| Python and Jupyter Overview | 12:45 - 1:15 | |
| Fundamentals | 1:15 - 2:00 | |
| Break | 2:00 - 2:15 | |
| Packages, Modules, Methods, Functions | 2:15 - 3:00 | |
| Importing Data | 3:00 - 3:45 | |
| Q&A | 3:45 - 4:15 | |
| Day 2 | Q&A | 12:45 - 1:00 |
| Selecting and Filtering Data | 1:00 - 1:45 | |
| Working with Columns | 1:45 - 2:30 | |
| Break | 2:30 - 2:45 | |
| Case Study, pt. 1 | 2:45 - 3:45 | |
| Q&A | 3:45 - 4:15 |
| Day | Topic | Time |
|---|---|---|
| Day 3 | Q&A | 12:45 - 1:00 |
| Review | 1:00 - 1:15 | |
| Summarizing Data | 1:15 - 2:00 | |
| Break | 2:00 - 2:15 | |
| Summarizing Grouped Data | 2:15 - 3:00 | |
| Joining Data | 3:00 - 3:45 | |
| Q&A | 3:45 - 4:15 | |
| Day 4 | Q&A | 12:45 - 1:00 |
| Exporting Data | 1:00 - 1:30 | |
| Visualizing Data | 1:30 - 2:30 | |
| Break | 2:30 - 2:45 | |
| Case Study, pt. 2 | 2:45 - 3:45 | |
| Q&A | 3:45 - 4:15 |
Technologies
Python
- Python is the programming language we'll be learning in this class.
- We are using Python 3.12, the newest version of Python, for the entirety of this class.
- The core libaries we will be using are
pandasandseaborn.
Jupyter
- Jupyter is the integrated development environment (IDE) we will be using.
- This is where we will write and run our Python code.
Course Material
- All of the material for this course can be reached from our GitHub repository.
- You can either access this material through Binder or by downloading the material
and opening it via Anaconda Navigator and JupyterLab.
Slides are notebooks
- We will be teaching using slides.
- These slides are created from the notebooks in the course repository -- so you can follow along and run the code in your notebook.
Source Code
- Source code for the training can be found on GitHub.
- This repository is public so you can clone (download) and/or refer to the materials at any point in the future.
Questions
Are there any questions before moving on?